
- 33
- 2 587 964
NanoWorld
South Korea
Приєднався 6 жов 2018
The purpose of this channel is to promote science and encourage researchers and scientists. This channel might be very helpful for those researchers who are interested in experimental science, especially in the field of material science and nanotechnology.
Precision in Action: Wire Bonding Machine Excellence | 11-second Showcase
Experience the artistry of modern manufacturing with our captivating 11-second glimpse into the world of wire-bonding machines. Witness the convergence of technology and craftsmanship as our state-of-the-art machine delicately connects wires, ensuring impeccable precision and reliability.
In this mesmerizing snippet, delve into the heart of innovation as the wire bonding machine seamlessly orchestrates intricate connections. With its robotic finesse, the machine navigates through a labyrinth of tiny wires, elegantly fusing them onto delicate components with unparalleled accuracy.
Join us in celebrating the marvels of engineering as this short yet impactful video transports you into the realm of microfabrication. Whether you're an industry enthusiast, a tech aficionado, or simply curious about the mechanics behind modern electronics, this video offers a tantalizing glimpse into the meticulous processes that power our interconnected world.
🔗 Stay connected with us for more fascinating insights into cutting-edge technology and precision engineering. Don't forget to like, share, and subscribe to our channel to keep up with the latest advancements in the field!
#WireBonding #PrecisionEngineering #ManufacturingExcellence #TechInnovation #ModernManufacturing
Переглядів: 1 526
Відео


Synthesis of MAX phase (for MXene) in high temperature tube furnace
Переглядів 1,7 тис.Рік тому
Tube furnace synthesis of titanium carbide (MAX phase). Later on, this MAX phase will be selectively etched to produce MXene (an emerging 2D material). For more updates follow us on, Facebook: FAscinatingNanoworld Twitter: NanoWorld8 Instagram: nanoworld85 Contact: fascinatingnanoworld@gmail.com More videos on data interpretation How to plot bar graph and...

How to plot bar graph with error bars - antibacterial activity data - 31
Переглядів 25 тис.2 роки тому
In this video, I have shown the interpretation of antimicrobial activity data of silver nanoparticles (Ag NPS). I plotted the ager well results as a bar graph and caped it with an error bar. The results were obtained by testing nanoparticles against 4 different multi-drug-resistant (MDR) pathogenic strains. Each bacterial strain is tested against 3 different concentrations of nanoparticles (1 m...
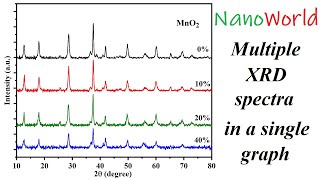
Multiple XRD spectra in a single graph - 30
Переглядів 74 тис.3 роки тому
In this video, I have shown how to plot multiple XRD spectra in a single graph using OriginLab software. If you have any questions, ask them in the comment section below. For more videos, please subscribe to NanoWorld. Thank you. #NanoWorld For more updates follow us on, Facebook: FAscinatingNanoworld Twitter: NanoWorld8 Instagram: nanoworld85 Contact: fa...
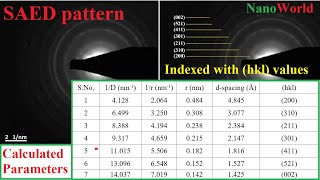
Interpretation of SAED pattern | estimation of d-spacing & (khl) values - 29
Переглядів 69 тис.3 роки тому
In this video, I have shown how to analyze Selected Area Electron Diffraction (SAED) pattern using ImageJ software. Like my other videos, this is the only available video on the internet, which shows some very important and simple tricks for interpretation of the SAED pattern. After watching this video, you will be able to calculate the following parameter from the SAED pattern: 1) 1/D (per nm)...

How to put a scale bar on SEM & TEM images (SEM/TEM data analysis) - 28
Переглядів 24 тис.3 роки тому
A manuscript may contain one, two, or more than two SEM/TEM images. When we combine two or more SEM/TEM images and put them in the manuscript, the scale bar becomes smaller and is very difficult to read it. Similarly, sometimes we need to put an image in the inset of another image. In such a case, the scale bar of the inset image becomes extremely small, and is not possible to read it normally....

Fixing of valid atomic position available error in X’pert Highscore - 27
Переглядів 11 тис.3 роки тому
"No valid atomic position available" error happens, when the structural information is not available in the select JCPDS card. In this video, I have shown how to get rid of the error “No valid atomic position available” when performing Rietveld refinement. If you have any questions, ask them in the comment section below. For more videos, please subscribe to NanoWorld. Thank you. #NanoWorld For ...

Fixing of Negative intensities in scan data points error in X’pert Highscore - 26
Переглядів 9 тис.3 роки тому
In this video, I have shown the Rietveld refinement of XRD spectra using X’pert Highscore software. When performing Rietveld refinement through X’pert Highscore software we sometimes face many types of errors including the “Negative intensities in scan data points” error. In this video, I have shown how to overcome this error when performing Rietveld refinement. If you have any questions, ask t...

Indexing XRD peaks with hkl values using X'pert highscore - 25
Переглядів 41 тис.3 роки тому
In my previous video (link is given below), I have shown how to label XRD peaks with Miller Indices (hkl) values using OriginLab software. Indexing XRD peaks through OriginLab could only be done manually, while the X’pert Highscore software could do the same task automatically. In this video, I have shown the labeling (indexing) method only. For a detailed analysis of XRD data through X’pert Hi...
How to plot JCPDS card with the XRD data using OriginLab - 24
Переглядів 91 тис.3 роки тому
In this video, I have shown how to plot the JCPDS (pattern) card with the XRD graph in 2 different ways. (Note: If you need any JCPDS card, just send me an email and tell us your desired card no i.e.01-023-0456) If you have any questions, ask them in the comment section below. For more videos, please subscribe to NanoWorld. Thank you. #NanoWorld For more updates follow us on, Facebook: facebook...
XRD data analysis using X'pert highscore software - 23
Переглядів 91 тис.3 роки тому
Xpert highscore software is specially designed for the analysis of X-ray diffraction data. In this video, I have shown data analysis using X'pert highscore software. I performed the following tasks: 1. Import XRD data file to X’pert Highscore software 2. Baseline correction 3. Search peaks 4. Search and match (With JCPDS card) 5. Save JCPDS card 6. Save data report For more videos, please subsc...
Deconvolution of photoluminescence PL spectra (peaks fitting) - 22
Переглядів 29 тис.3 роки тому
In this video, I have shown deconvolution of photoluminescence (PL) spectra i.e. PL peaks fitting using OriginLab software. After deconvolution, I label the peaks with wavelength and assign a color to each peak according to their emission band. #NanoWorld For more updates follow us on, Facebook: FAscinatingNanoworld Twitter: NanoWorld8 Instagram: nanoworld...
Electron paramagnetic resonance data analysis (Calculation of g-factor) - 21
Переглядів 33 тис.3 роки тому
Reference article: www.sciencedirect.com/science/article/pii/S104458032032132X Electron paramagnetic resonance (EPR) sometimes also known as electron spin resonance (ESR) spectroscopy is a very sensitive and powerful analytical tool used for the detection of different oxidation states and the chemical environment of an atom. It also tells the atom has either tetrahedral or octahedral coordinati...
TGA & DSC double plot (double Y-axis in a single graph) - 20
Переглядів 15 тис.3 роки тому
In this video, I have shown 2 methods about how to plot TGA and DSC spectra in a single graph using OriginLab software. The double X-axis is common for both Y-axis. #NanoWorld TGA Data Analysis (Detailed analysis) ua-cam.com/video/J4jBy_NOqEM/v-deo.html DSC Data Analysis (Detailed analysis) ua-cam.com/video/QlD3H_s5sZ8/v-deo.html For more updates follow us on, Facebook: FAscinating...
Grain (crystallites) size through modified Scherrer equation - 19
Переглядів 17 тис.4 роки тому
Grain (crystallites) size through modified Scherrer equation - 19
How to know a material has either direct or indirect bandgap energy - 18
Переглядів 58 тис.4 роки тому
How to know a material has either direct or indirect bandgap energy - 18
CV Data Analysis through OriginLab - Calculation of Specific Capacitance - 17
Переглядів 69 тис.4 роки тому
CV Data Analysis through OriginLab - Calculation of Specific Capacitance - 17
DSC Analysis Through OriginLab - Enthalpy and Specific Heat Capacity - 16
Переглядів 95 тис.4 роки тому
DSC Analysis Through OriginLab - Enthalpy and Specific Heat Capacity - 16
TGA Analysis Through OriginLab (Thermal properties of nanomaterials) - 15
Переглядів 109 тис.4 роки тому
TGA Analysis Through OriginLab (Thermal properties of nanomaterials) - 15
strain and dislocation density from XRD data - 14
Переглядів 41 тис.4 роки тому
strain and dislocation density from XRD data - 14
crystallites (grain) size and strain through W-H plot method - 13
Переглядів 98 тис.4 роки тому
crystallites (grain) size and strain through W-H plot method - 13
How to calculate lattice constant (a,b,c) values of a unit cell from XRD data - 12
Переглядів 139 тис.4 роки тому
How to calculate lattice constant (a,b,c) values of a unit cell from XRD data - 12
How to label XRD peaks with Miller indices - (hkl) values - 11
Переглядів 112 тис.4 роки тому
How to label XRD peaks with Miller indices - (hkl) values - 11
How to calculate d-spacing / interplaner spacing from XRD data - 10
Переглядів 66 тис.4 роки тому
How to calculate d-spacing / interplaner spacing from XRD data - 10
Crystallites (grain) size from XRD data using Scherrer equation - 09
Переглядів 293 тис.5 років тому
Crystallites (grain) size from XRD data using Scherrer equation - 09
How to find peak position and FWHM of XRD data - 08
Переглядів 98 тис.5 років тому
How to find peak position and FWHM of XRD data - 08
Bandgap energy using Kubelka Munk function (DRS data Analysis) - 07
Переглядів 59 тис.5 років тому
Bandgap energy using Kubelka Munk function (DRS data Analysis) - 07
how to calculate crystallinity from XRD data using OriginLab - 06
Переглядів 165 тис.5 років тому
how to calculate crystallinity from XRD data using OriginLab - 06
How to smooth data (XRD) using OriginLab software - 05
Переглядів 237 тис.5 років тому
How to smooth data (XRD) using OriginLab software - 05
Baseline correction for XRD, FTIR, and Raman Spectroscopy (OriginLab) - 04
Переглядів 57 тис.5 років тому
Baseline correction for XRD, FTIR, and Raman Spectroscopy (OriginLab) - 04
can u explain what is granularity in background window?? in one of my peaks i am analysing, i am getting a peak in the negative intensity direction, so when i am increasing the granularity, its disappearing. what does granularity mean?
Excellent Video! So useful!!!!!!
Excellent video
Hi JCPDS card number.... 96-101-1268 And 96-101-1663
i am working on high entropy Ceramics and i am unable analyze the XRD data via Xperthigh score due to lacking of the data cards related to my sample composition (Hf,Mo,Zr,Ti,Mo,W)B2 i only have the 2 theta and its intensity .. can you help me out from this.
Thank you so much for this video.
A few people are confused about the conversion of.......1/D nm-1 into 1/r. You need to divide the 1/D values by 2. The formula for the conversion is 1/r = 1/D × (L / λ) / 2. Where: 1/D is the reciprocal space measurement in the SAED pattern. L is the camera length of the TEM. λ is the wavelength of the electron beam. The reason for dividing by 2 is that the diffraction spots in a SAED pattern correspond to the scattering vector, which is defined as: q = 2π / d. Where d is the real-space interplanar spacing. Thank you in advance
Good evening... Could you please publish a video for us on the method of analyzing the plasma spectrum using the Origin program... It includes calculating the Debye temperature, electron density and other parameters, please... Because we are in dire need of this analysis, we are followers of your distinguished UA-cam channel.
What a class, thank you very much!
Mashallah great
Kindly make a video on how to plot TR-PL analysis as there is no perfect video on it. Thanks in advance!
Muito bom!!
at 7:15 you calculate indirect gap n=2
thanks, that was so usefull
hello! can you give me the JCPDS database for JCPDS 27-0050 (β-Bi2O3), JCPDS 39-1346 (γ-Fe₂O₃), JCPDS 36-1451 (ZnO), and JCPDS 71-2494 (BiFeO3). Thank you very much!
Thank you so much, this is very useful
Can anyone explain what he did after writing H ....😢am stuck at that point
At what point exactly?
@@nanoworld6122 when you are writing formula in excel for D calculation ? Kindly tell me
how can i get a database of XRD patterns?
Can you tell me that how you calculate this data .....which you plot in a graph ?
Thank you.
hello sir may i know where to get the database for jcpds
You are a lifesaver! Thank you so much for making such a well-explained and clear step-by-step video 🙏
Hello Sir... how to find jcpds card number of files obtained from xpert highscore
Plz prof, could you send me a JCPD card of graphene oxide?
if we dont have JCPDS card, how can we calculate miller indices??
Excellent video, covered every aspect. I have one question kindly respond to clarify concept of the community. Right from the start, obtaining 1/2r, till matching d spacing you video is very coherent. However, to obtain 1/r (2nd column of the table) from 1/2r, instead of dividing it by 2 (which you did), should we not do the multiplication? i.e. 1/2r * 2 = 1/r
my overlay graphs are not coming to be equal in length
Can you plz snd JCPDS card of ZnO
brilliant job (y)
HELLO SIR, MAY YOU PLEASE PROVIDE ME JCPDS CARD FOR CADMIUM HYDROXIDE
Can I change the sizes of the texts M1,M2...?
How did you convert ASC from origin
My graph didn't grow up like this in proper order 😭😭😭 what i have to do sir please guide me 😭😭😭
Sir in my data the graph peak is not that much big it's a small peaks and the graph doesn't grow like this how i select the band gap line then ?
EXCELLANT👍👍👍
关注,点赞加分享,谢谢up主的分享!
rietveld refinement is not working in my xpert high score plus, so I can't find (h k l) values. please solve the issue.
Can anyone know where i can get origin?
Many thanks!
Thank you so much.👍
brilliant. thank you sir
Its helpful, you earned a subcription. Thanks!
what point did you pick to draw the straigth line
Thank you it's helpful
Should I adjust the baseline so that it touches some base-part of XRD graph?
Hey sir, i want to find jcpsd card for titanium carbide ti3c2. Can you send me?
Thanks a lot sir
can you help me getting jcpds no. 09-0432 🙌
How can adjust the same distance along y-axis of different peaks?
How can adjust the same distance along y-axis of different peaks?